
Create a Histogram with Excel
Learn Data Viz - https://www.udemy.com/tableau-accelerate-your-career-and-get-certified/?couponCode=TableauFive. Histograms are the first step when investigating continuous data. You can create histograms with the Excel data analysis toolpak, but the default settings are misleading and ugly. This video shows how to make great looking histograms in Excel.
Comments
Related Posts

Pivot Table है Excel का Power Tool जरूर सीखें - Pivot table in excel

Financial Statements Template in Excel - How to Prepare Financial Statements

5 skills to learn to get a job as Software Engineer
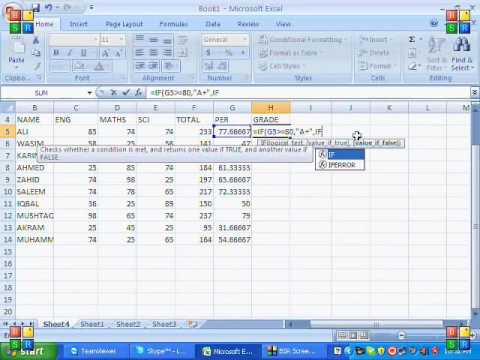
Formula of Sum, Percentage, If Function, Merge & Center MS Excel 2007 Tutorial in Hindi
Other Functions as Arguments - MS-Excel Tutorial


